At the track, open Google Chrome
on your device connected to the IMSA router and enter the IP address of
your P1TS server (displayed on its title bar). See the Install Guide's
Chrome URL section.
Click either the Strat 1 or Strategist
button..
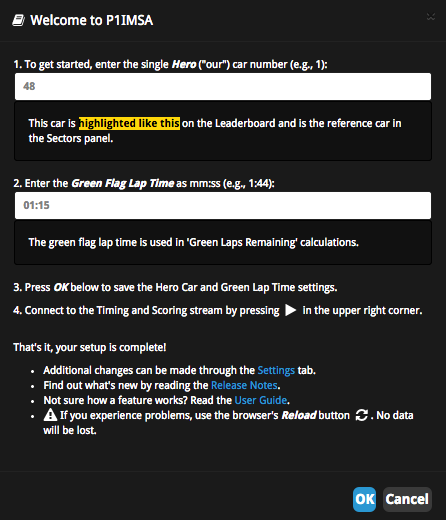
Follow the directions on the Welcome dialog box that pops up. Welcome (hero #48, green lap time 1:15)
P1TS can improve your practice, qualifying, and race
results by raising your race awareness with past, present, and predicted information
about your current session.
Central to its design is a hero car approach, where information
is presented relative to your car.
The Strategist webapp is divided into a series of tabbed screens.
Every tab shares the same status strip and ▶connect button along the top
and a Save as PDF button along the bottom.
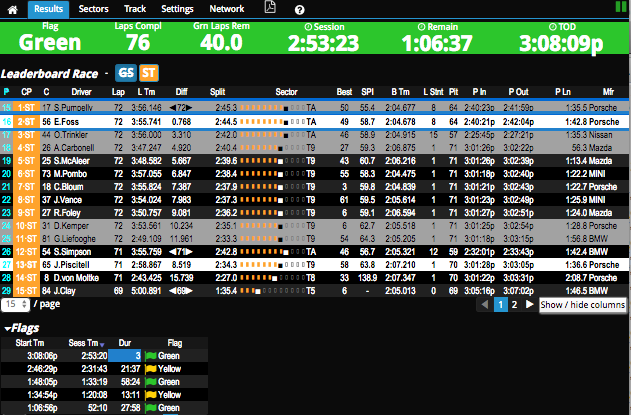
The Results tab renders a
Leaderboard grid.
Car classes may be filtered by buttons.
Hover over the column headers to see their definitions.
P - Overall Position
CP - Class Position
C - Car Number
Driver - Current Driver
Lap - Last completed Lap Number
Diff - Last completed Lap Number or Time behind last S/F
Split - Time since last S/F Crossing
Sector - Last completed Sector
Best - Best Lap Number
SPI - Speed Trap MPH
B Tm - Best Lap Time
L Stnt - Number of Laps completed in current Stint
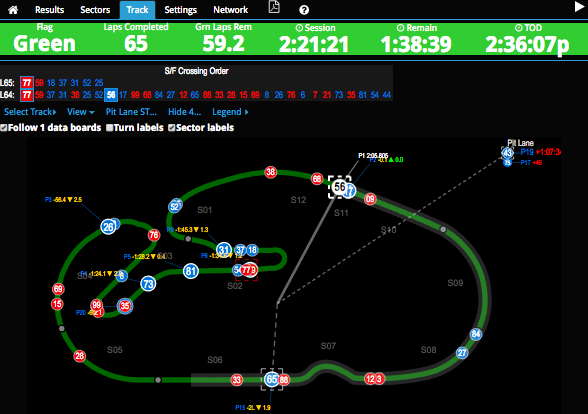
The Track tab contains
Start/Finish Crossing Order data for the last two laps
(hidden by default but may be toggled through a Setting).
The Track Map models car movement and annotates important
about key cars.
Track tab
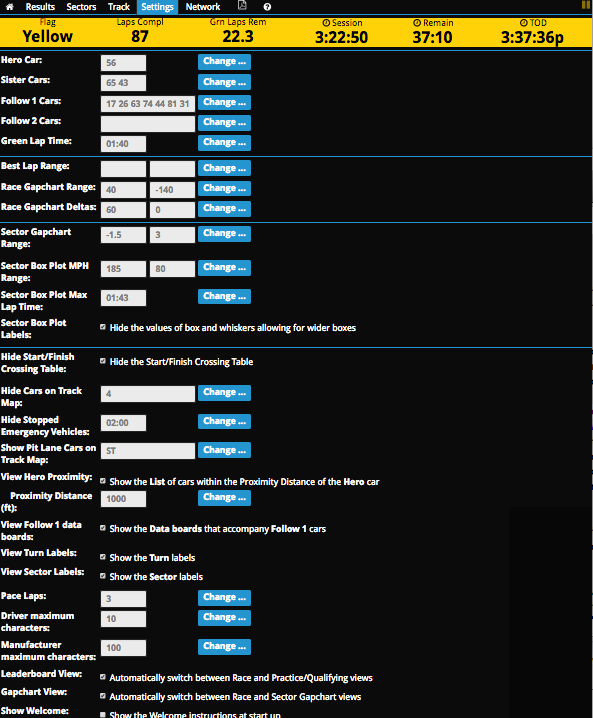
The Settings tab contains all
changeable settings in one place
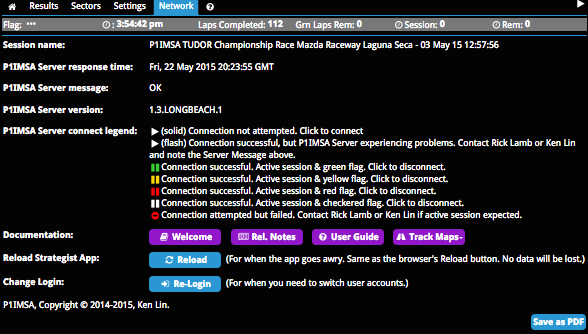
The Network tab displays information
about the P1TS Server as well as your account name and expiration
date (not pictured below).
It is useful to consult this page if things seem amiss.
It also has (purple) links to all documentation.
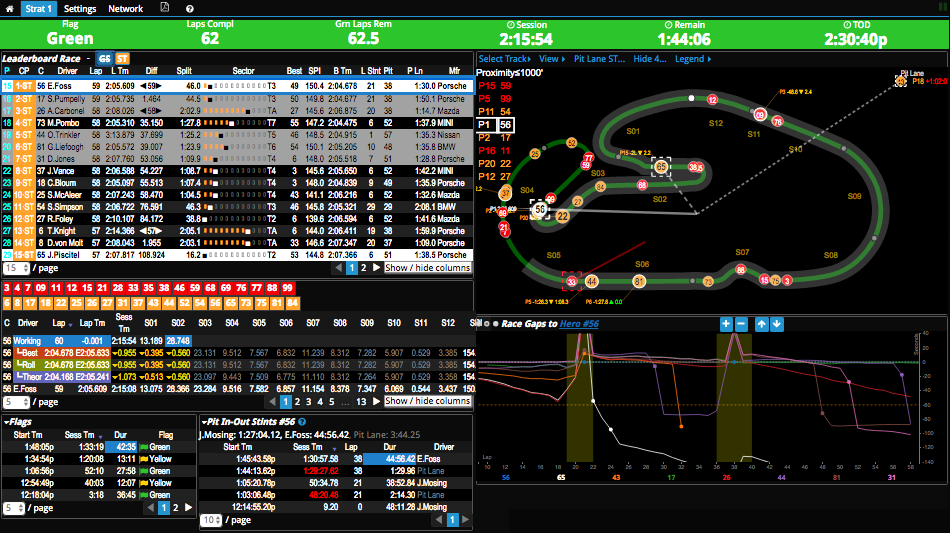
The new Strat 1 webapp arranges all the panels of the
Strategist webapp's Results,
Sectors, and Track tabs onto a single view
for hi-resolution displays.
If your screen is a bit small, use the Chrome browser's Zoom
feature to help fit all the panels comfortably.
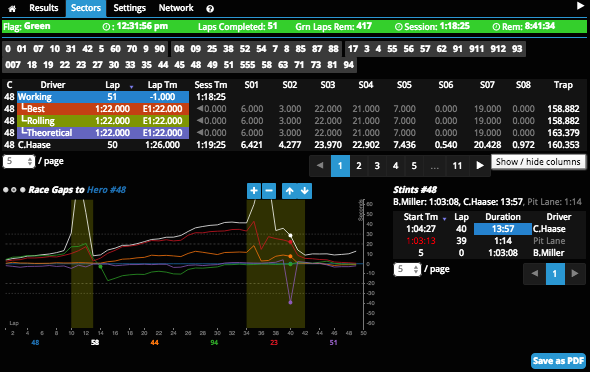
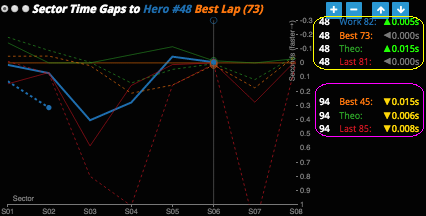
The Sectors Grid on the Sectors tab displays
all of the Selected car's current Working (top row) and completed
lap and sector times.
Best - Completed lap with the best laptime.
Rolling - Completed rolling lap (contiguous sectors) with the best laptime.
Theoretical - Completed best sector times.
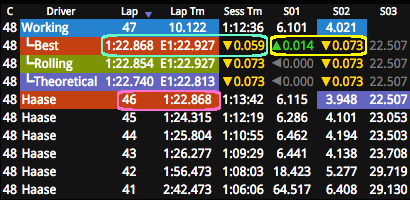
Detail of Sectors Grid (selected #48)
Sector-by-sector comparison (▲▼)
The difference between the working lap's sector times with the best
(yellow rectangle above), rolling, and theoretical sector times
is displayed. For example,
The display shows that the current Working lap is 0.014 seconds
▲faster in S01
... but 0.073 seconds ▼slower in S02
than the Best lap's corresponding sectors.
Predicted lap time (E)
The predicted Working lap time is calculated using the remaining sector
times from the Best, Rolling, and Theoretical laps.
For example,
The Best lap's time is 1:22.868 (Best:Lap), which was on lap 46
(magenta rectangle) - both rows have the same orange background.
The Working lap's expected time if the remaining sectors match the
Best lap's sector times is E1:22.927 (Best:LapTm).
This is 0.059 seconds (Best:SessTm) slower than the Best lap time.
Note: "E" for estimate is used instead of "P", as the latter is used elsewhere to
denote "pitstop".
Best Lap Range
Normally all laps are used when determining the best,
rolling, and theoretical. The lap range can
be changed var the Settings tab's Best Lap Range.
Normally the Best Lap from ERMon timing and scoring is used; when the best lap range
is specified, P1TS performs its own calculations.
The lap range settings are useful when you want to examine the
best laps for a particular driver's stint.
For example, if an amateur driver is driving, you can focus on his best sector
times by setting the lower range to the lap that he started driving this stint.
Otherwise, the best sector times may be overshadowed by the pro driver.
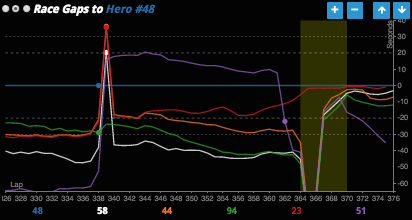
The Sectors Gapchart on the Sectors tab
compares sector time gaps to the hero car's best lap.
The x axis displays the sectors and the y axis displays the +/-
time gaps in seconds (configurable in Settings tab) to
the hero car's best lap.
Faster sector times ahead of the hero car's best lap are above
this zero line while slower sector times appear below.
Best - Completed lap with the best laptime.
Rolling - Completed rolling lap (contiguous sectors) with the best laptime.
Theoretical - Completed best sector times.
Sectors Gapchart (hero #48, selected #94)
When the car selected in the Sectors tab is the
hero car, four solid lines will be charted for the
time gaps of the Working (wide), Best (zero line),
Theoretical, and last laps and numeric values will be displayed
(yellow rectangle).
Also, the progress of the working lap is tracked with a marker on the
most recent sector.
This is a visual equivalent to the top working lap row of the
Sectors Grid.
When the car selected in the Sectors tab is a car
other than the hero car, four dashed lines
will also be charted and numeric values will be displayed (magenta rectangle).
This car-to-hero comparison capability has no analog in the
Sectors Grid.
Note: Rolling laps are not charted as it tends to have many of the
same sector times as the Best and Theoretical laps.
The Laps Gapchart provides an overall view of time gaps to the hero car.
The x axis displays the most recent (up to 50) laps and the y
axis displays the +/- time gaps in seconds (configurable in Settings tab).
Cars ahead of the hero are above his zero line while cars behind appear below.
Pitstops are displayed as circles.
Yellow flag periods are displayed as vertical bands.
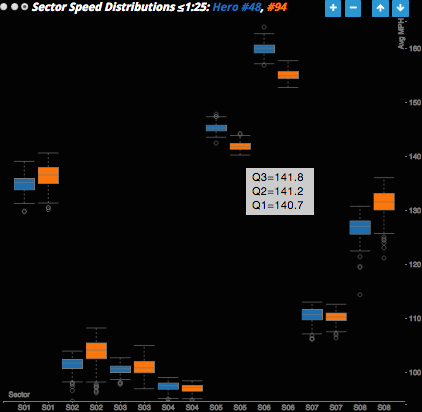
The Sector Speed Distributions chart is a box and whisker
plot that shows the "meat" of average sector speeds for the hero's
current session.
The box represents the middle half of the computed average sectors
speeds.
The whiskers represents the range of computed average sectors speeds
near the box. Those lying outside the whiskers are outliers.
The average sector speeds are calculated from the sector times and the
sector distances.
The set of laps used in computing the plots is pruned by omitting laps whose
times are slower than the Sector Box Plot Maximum Time
setting.
This allows to you filter out artificially slow laps (e.g., yellow) from the
box plot data if you wish.
When the car selected in the Sectors tab is a car
other than the hero car, a second set of
plots will be displayed allowing easy comparison.
Hovering over a box reveals its values.
Sectors Speed Distribution (hero #48, selected #94, cutoff 1:25)
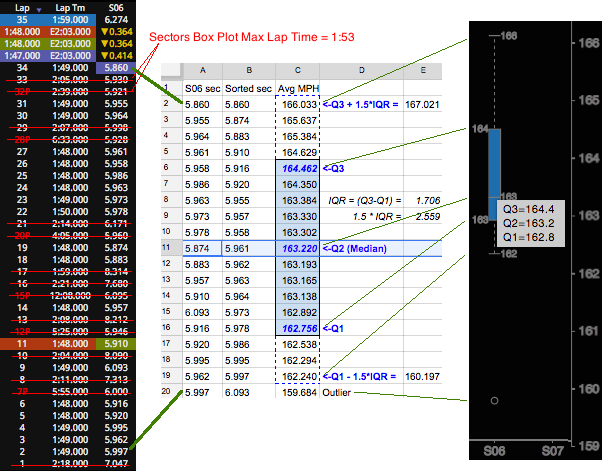
A box and whisker plot allows you to visualize a distribution of numbers, in
this case the average sector speeds. The example below explains how the S06
column of a plot is produced. Reading from left to right ...
34 laps have been completed. There are some laps we'd probably like removed
from our plot - in this case, after looking over lap times, Sectors
Box Plot Max Lap Time is somewhat arbitrarily set 1:53 to omit some
of the pit-in and pit-out laps.
This leaves us with 19 laps whose S06 times I've transcribed into column A
of a spreadsheet.
We now sort these 19 laps in column B and knowing the sector length,
calculate the average S06 sector speeds in column C.
The median (midpoint), also known in statistics as Q2 (quartile 2), is the
10th average sector speed (163.220 mph).
We take the median of numbers above Q2 to get Q3 (164.462 mph) and take the
median of the numbers below Q2 to get Q1 (162.756 mph). The values between
Q3 and Q1 form the (blue) box portion of the plot, showing the "meat".
In statistics, the interquartile range (IQR), or the midspread, is
defined to be Q3 - Q1 (1.706 mph).
Actual values within 1.5 IQRs (2.559 mph) above Q3 (167.021 mph) or within
1.5 IQRs below Q1 (160.187) form the (dotted) whiskers of the plot.
Outliers are values outside this range and are represented with
circles (159.684 mph).
How a Box and Whisker is Created
Now that you understand how box and whisker plots are produced, look again
at the column of 34 numbers and look at the plot - which is easier to
understand at a glance?
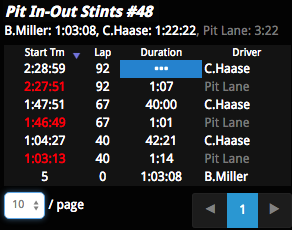
The Pit In-Out Stints panel displays both the session chronology
and summary of driver and pit lanes times for the selected car.
The pit-in and pit-out time line crossings
divide the chronology.
When the Driver column contains "Pit Lane", the Start Tm and Lap columns
indicate respective values when the car crossed the pit-in
time line.
IMPORTANT: The simplistic time division employed here, based on
pit-in and pit-out, does NOT capture the
changing intricacies of IMSA's drive time calculations.
Also, while delayed driver plug ins during driver changes may be manually
corrected by IMSA, P1TS can only rely on information available in the timing
stream. You should have an additional means of calculating drive times.
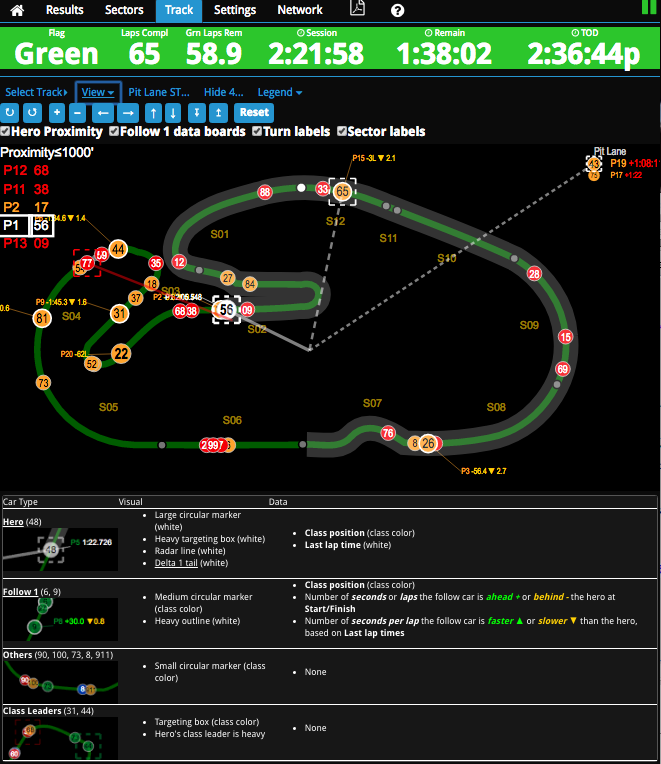
A major addition to P1TS for 2017 is a detailed track map.
Data boards for the hero, sister, and follow 1 cars display
useful race information.
Please refer to its Legend for details.
The View drop-down selection allows you to
rotate, pan, zoom the track map and also specify the elements you want to
see.
Follow 1 data boards
Turn labels
Sector labels
The Pit Lane... selection (e.g., ST) allows you to limit the
cars displayed in the Pit Lane panel.
A Hide... selection (e.g., 4) allows you
to specify the set of cars to hide. These cars will not appear on the Track Map.
Possible uses can be to remove stranded cars or cars you simply
don't want to see.
Detailed Track Map
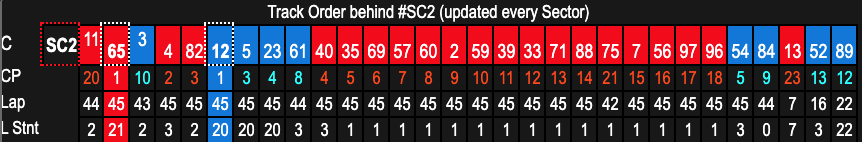
The Track Order panel accompanies track map to help visualize
IMSA Full Course Yellow Pass-Arounds behind SC or overall leader.
Ordering is updated at every intermediate timing loop crossing.
C: Pass-around eligible cars between SC and class
leaders will be vertically offset.
CP: Class-color coded class scored position (updated at S/F).
Each page has a "Save as PDF" button in its lower right corner, allowing you
to save the screen to a file on your USB memory stick to transfer to a computer
with a printer.
Because of Google Chrome's "sandbox" protection mechanisms, the P1TS webapp
is not capable of saving the file directly.
Instead, the button invokes Chrome's Print capability.
After pressing "Save as PDF" you must then take the following steps:
In the resulting Chrome Print dialog box, change the
Destination to "Save as PDF".
In the dialog box press Save and select a locations on
your USB memory stick.
Transfer the file on the USB memory stick to a computer back at your
paddock that has an attached printer and print the PDF file there.
The Network tab has a Replay button which allows
you to replay past ERMon sessions that IMSA publishes.
The Replay menu has a partial list of replay files, which requires
Internet access whether you are using p1ts.com
or a P1TS running on your own PC (not p1ts.com).
If the one you wish to replay is not there, on your own PC (not p1ts.com),
do the following:
At results.imsa.com
find the event and session you wish to replay.
For 2017 and later, these files were usually titled Replay.txt
and usually appear on the website under a CSV and Replay
subfolder, embedded in a .zip file.
Download the zip file to your PC and unzip it.
Move and give the resulting Replay.txt file a nice short name like
c:\daytona-race.txt.
In the P1TS Network Replay dialog, enter the nice short
file name into its Downloaded Replay field.
This table summarizes which P1TS Server instances
(p1ts.com or your PC) can
play which replay files.
P1TS is able to run on a number of different devices supported by Google Chrome
ranging from desktops computers to phones, even some SmartTVs!
Here is a list of devices running Chrome that we've successfully run P1TS on:
Windows 7, 8, and 10 PCs
Apple OSX Mavericks and Yosemite
Apple iOS iPads, iPhones, iPod Touch
Android tablets and phones
To work with WiFi devices such as MacBooks, tablets, and smart phones, purchase
a home WiFi router and cascade it off the IMSA router.
Then configure your wireless devices to connect to your WiFi router.
Beware if these devices have already been configured to use MiFis or portable
hotspots - if both the device and the hotspots are in the vicinity of your WiFi
router, your device may decide switch to the hotspot network, in which case your
P1TS webapp will not be able to get to the P1TS server.
You can avoid this by using hard-wired Ethernet for your laptops if they have
registered your hotspots.
Chrome for Android devices have a pull-to-refresh effect
which refreshes the page when you swipe down. This is probably undesirable
in a race environment where perhaps a tablet is passed to a driver and while
being handed off, there are accidental swipes which reload the app.
You may disable this via
chrome://flags/#disable-pull-to-refresh-effect.
For more information about WiFi deployments, please refer to the P1TS Install Guide's
WiFi section.