P1TS is software that helps race engineers and strategists
make informed race decisions by improving situational awareness from
Timing and Scoring data that competitors license from IMSA.
This Fact Sheet briefly illustrates how P1TS can be used to
assist race engineers and strategists in solving many of the race strategy
problems they face by understanding data such as: lap times,
gap times, driving times,
pit times, and their deltas and
trends.
For a thorough review description of P1TS, please refer to the following guides.
Requirements
P1TS has fairly modest hardware and software requirements.
- Both IMSA and SROMA teams need one or more Google Chrome
browser devices (Windows, Mac, tablet) to run the P1TS web app.
- While SROMA teams connect to the website that run the P1TS server on the web,
IMSA teams will additionally need one or more Windows PCs to
install and run the P1TS Server connected to their IMSA
MicroTik router at the pit wall network.
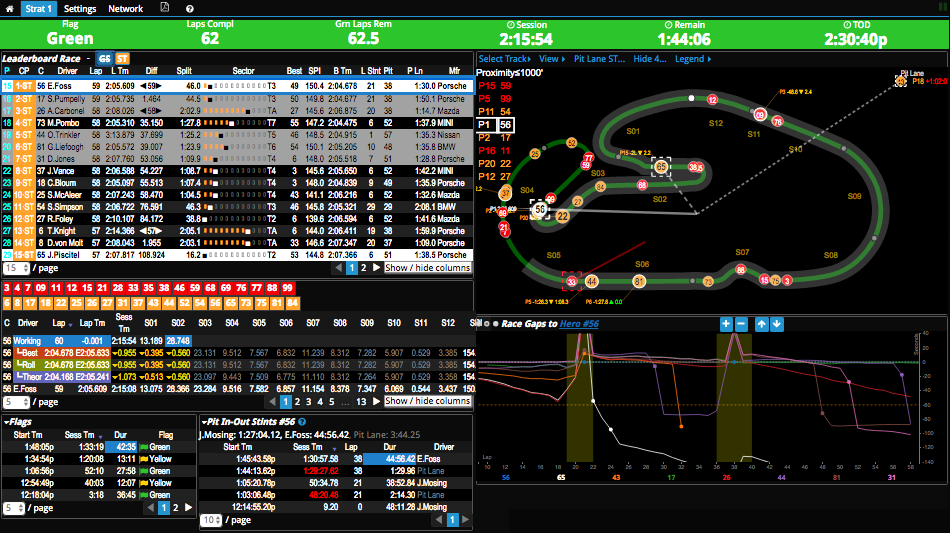
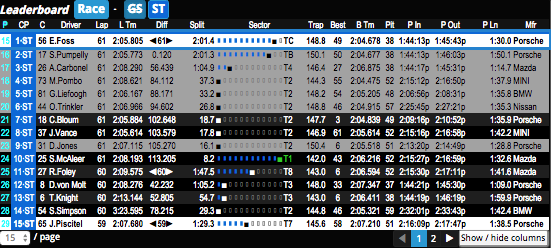
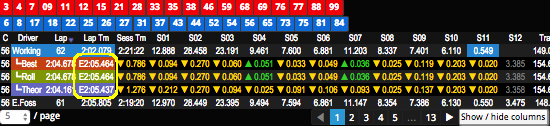
Leaderboard
The Leaderboard table displays key data about each
competitor.
- You may reduce noise by selecting the classes and columns you wish to
Show/Hide.
- Your Hero car (#56), Sister cars (#65,
#43 on page 2),
and other cars you want to closely Follow
(#17, #28, #73, #81, #44, #31) are highlighted.
|
|
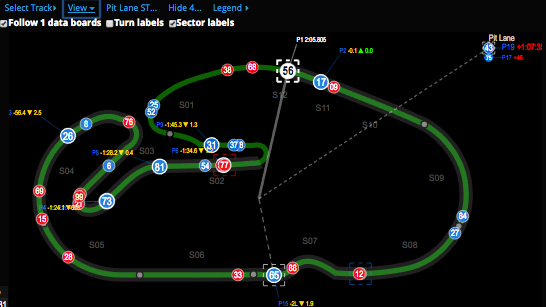
Track Map
The Track Map individually models car movement using
their earlier sector times.
- Hero (#56) and Sister cars (#65, #43) can be immediately located by
Target Boxes and Radar Lines.
- Follow cars (#17, #28, #73, #81, #44, #31) are larger and have
Data Boards circulating with their car markers,
showing their Class Position as well as their
start/finish Gaps and Closing Rates
relative to your Hero.
- Non-follow cars are smaller reducing noise.
- A Hero Tail configured with your pit delta allows you to
see how a stop affects pit stop overtaking.
- Target Boxes also highlight class leaders.
- A Circular map (not shown) may be used to easily
visualize the circuit by time.
|
|
Track Order
The Track Order panel accompanies track map to help visualize
IMSA Full Course Yellow Pass-Arounds behind SC or overall leader.
Ordering is updated at every intermediate timing loop crossing.
- C: Pass-around eligible cars between SC and class
leaders will be vertically offset.
- CP: Class-color coded class scored position (updated at S/F).
- Lap: Number of completed laps.
- L Stnt: Number of laps in current stint.
|
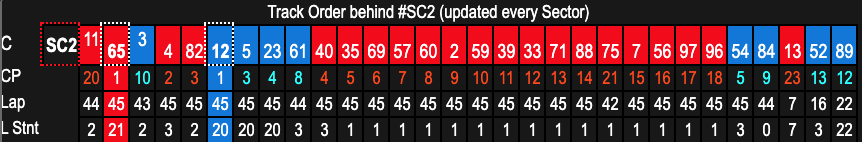
Cars 11 and 3 are eligible for pass-arounds.
Video here.
|
Sectors
The Sectors panel details sector and lap times for the
selected car.
- The Working lap's (L62) sectors times are recorded as
sectors are completed.
- Faster▲ and
Slower▼ arrows show how each working
lap's sectors compares with his Best,
Rolling, and Theoretical lap's sector
times.
- E-prefixed (estimated) lap times (circled), predict the
working lap time, by pulling remaining sector times from Best, Rolling,
and Theoretical.
|
|
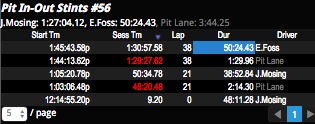
Pits & Stints
The Pit In-Out Stints panel displays both the session chronology and summary
of driver and pit lanes times for the selected car.
The pit-in and pit-out time line crossings divide the chronology.
IMPORTANT: The straightforward time division employed here
does NOT capture the changing intricacies of IMSA's drive time
calculations. Also, while delayed driver plug ins during driver changes may
be manually corrected by IMSA, P1TS can only rely on information available
in the timing stream. You should have an additional means of calculating
drive times.
|
|
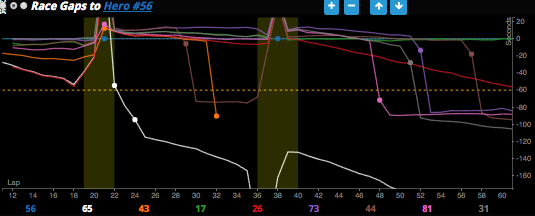
Race Gap Chart
The Race Gapchart assists strategically visualizing the race
via a chronological view of time gaps to the Hero car.
The X axis tracks the most recent (50) laps and the Y axis displays
+/- time gaps.
- Cars ahead of the hero are above his Y=0 line while cars behind appear
below.
- Pit stops are indicated as circles.
- Yellow flag periods are displayed as vertical bands.
- A dotted horizontal (orange) pit stop delta line allows you to visualize
overtaking in the pits.
P1TS - Phoenix American Motorsports Case Study details its practical
use.
|
|